The State of Video Encoding | Early Access

Thank You for Helping Shape This Report

The 2026 State of Video Encoding Report exist because 286 engineers, architects, and executives took the time to share what they’re actually doing – not what the industry wishes were true. You were part of that.

This is the full 46-page report. No shortened version, no summary. The same data, analysis, and archetype breakdowns that will be released publicly, in your hands first.

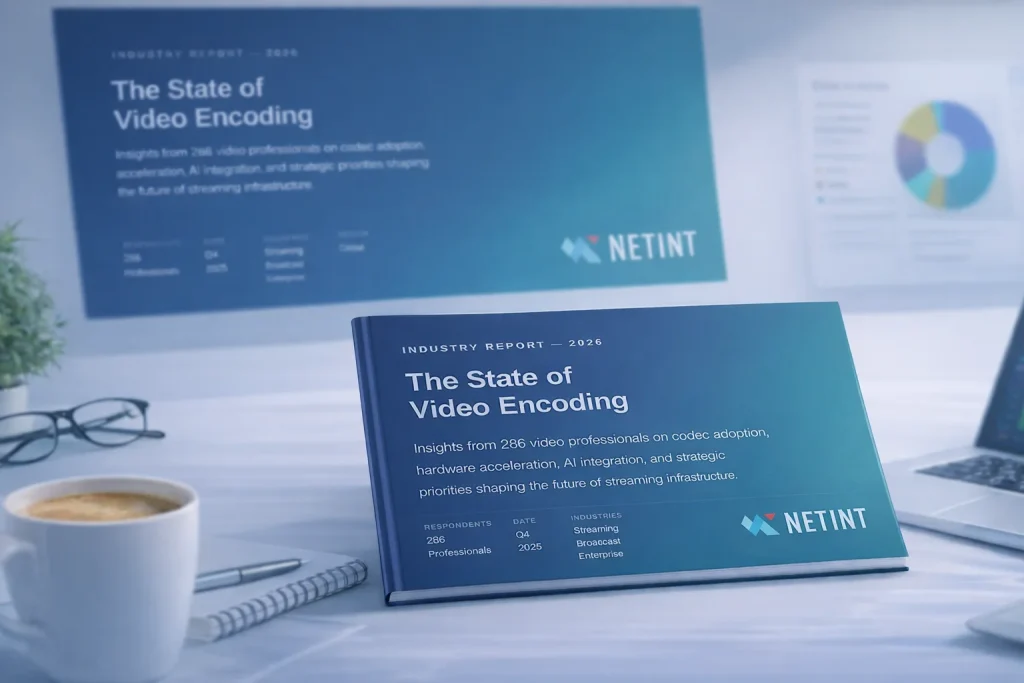
Blue gradient booklet on a desk titled 'The State of Video Encoding' with the NETINT logo visible, beside a coffee cup and glasses in the foreground.

Industry data is only as good as the people behind it

Surveys like this one work because practitioners and decision-makers contribute honestly.

The result is a clearer picture of where the industry actually stands – on codec adoption, hardware decisions, AI integration, and the constraints that slow everything down.

That clarity helps all of us make better decisions. We hope this report is useful to you in return.

EMEA, North America, APAC, LATAM, Global

professionals surveyed
0
VP-level or above
0 %
engineers and architects
0 %

10 insights you'll find inside

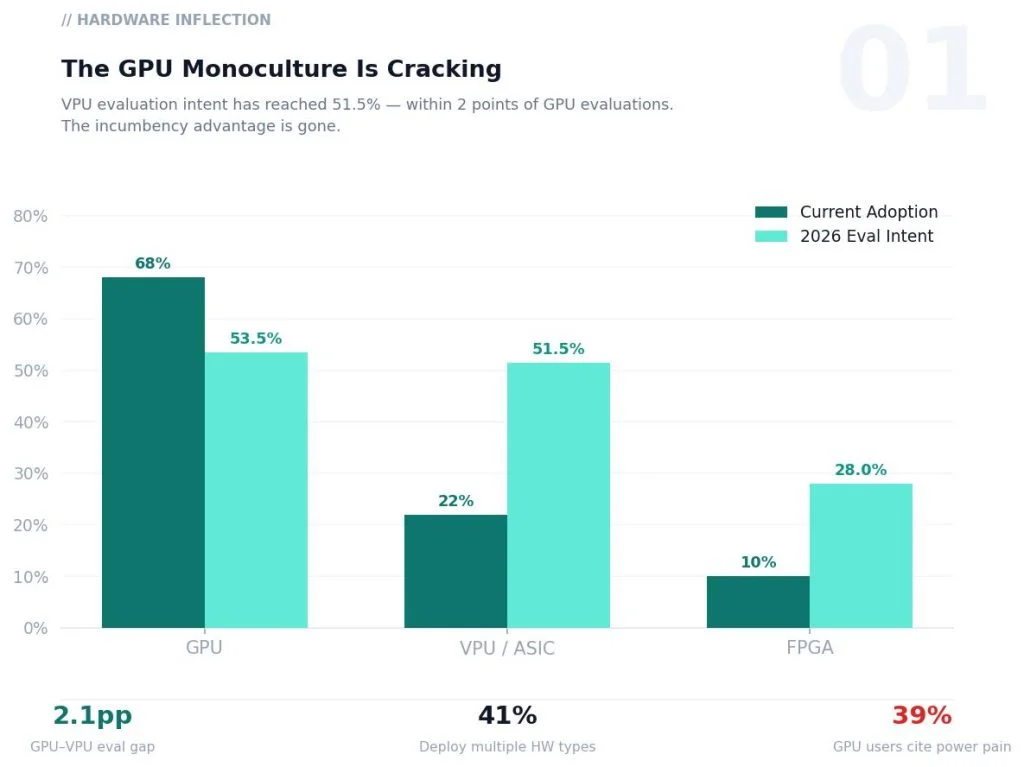
Infographic titled 'The GPU Monoculture Is Cracking' with a bar chart comparing Current Adoption (dark teal) and 2026 Eval Intent (light teal) across GPU, VPU/ASIC, and FPGA. GPU: 68% vs 53.5%; VPU/ASIC: 22% vs 51.5%; FPGA: 10% vs 28%. Includes bottom metrics: 2.1pp GPU–VPU eval gap, 41% deploy multiple HW types, 39% GPU users cite power pain.

01

The hardware monoculture is cracking

GPU and VPU evaluation intent are now within 2 percentage points of each other — 53.6% vs. 51.5%. For the first time in a decade, GPU incumbency doesn’t guarantee selection. 41% of hardware users already deploy more than one hardware type. The window to capture organizations diversifying away from GPUs is 12–18 months.

02

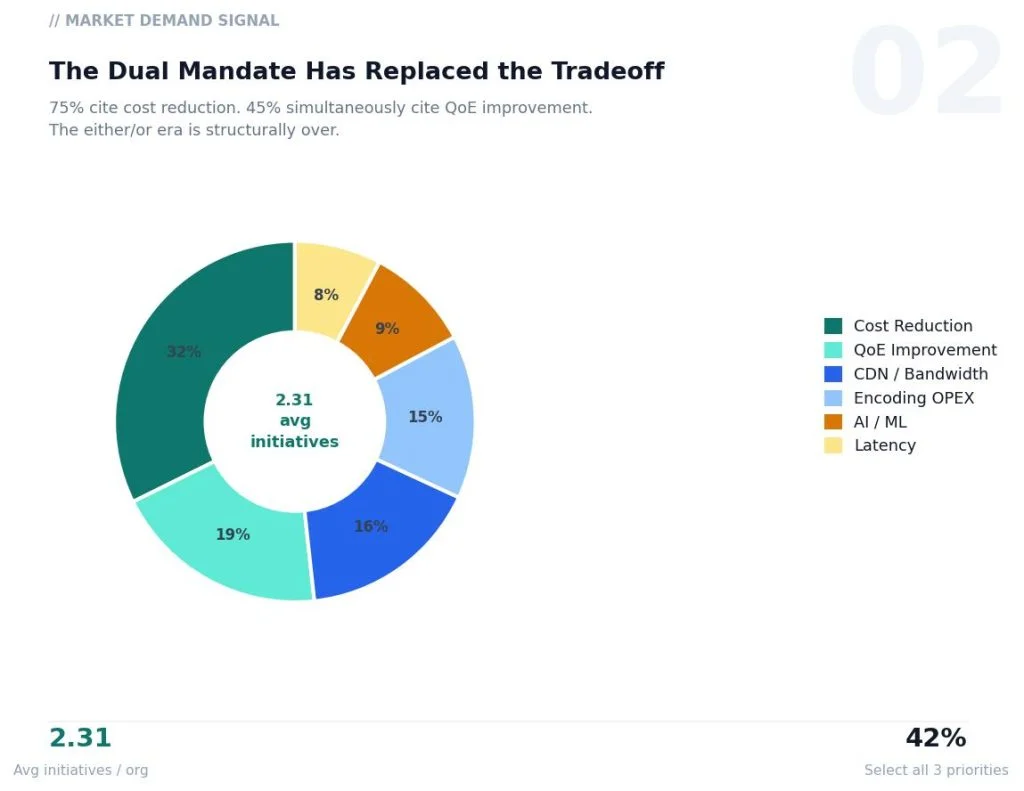
Cost and quality stopped being a tradeoff

75% of respondents cite at least one cost-reduction initiative. 45% simultaneously cite quality-of-experience improvement. Organizations are pursuing an average of 2.31 initiatives at once. Solutions that force a choice between cost and quality are facing structural resistance from buyers.

Donut chart titled Market Demand Signal showing initiative categories and their shares: Cost Reduction 32%, QoE Improvement 19%, CDN/Bandwidth 16%, Encoding OPEX 15%, AI/ML 9%, Latency 8%.
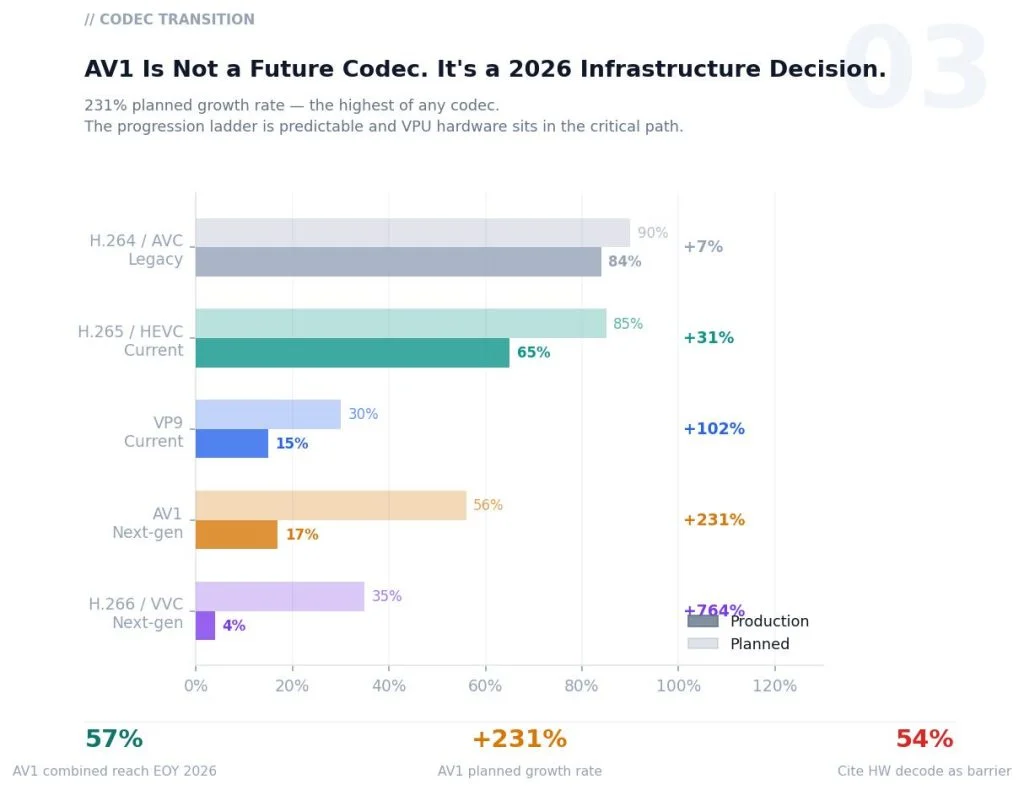
Infographic: AV1 transition with production vs planned percentages for H.264, H.265, VP9, AV1, and H.266; AV1 projected reach by 2026.

03

AV1 isn't a future codec.
It's a 2026 infrastructure decision

AV1 is currently in production at 17% of organizations. By end of 2026, 57% will have deployed or planned it – a 231% planned growth rate, the highest of any codec. Organizations with VP9 already deployed are 27x more likely to be running AV1. If you don’t have an AV1 roadmap, you’re already behind the curve.

04

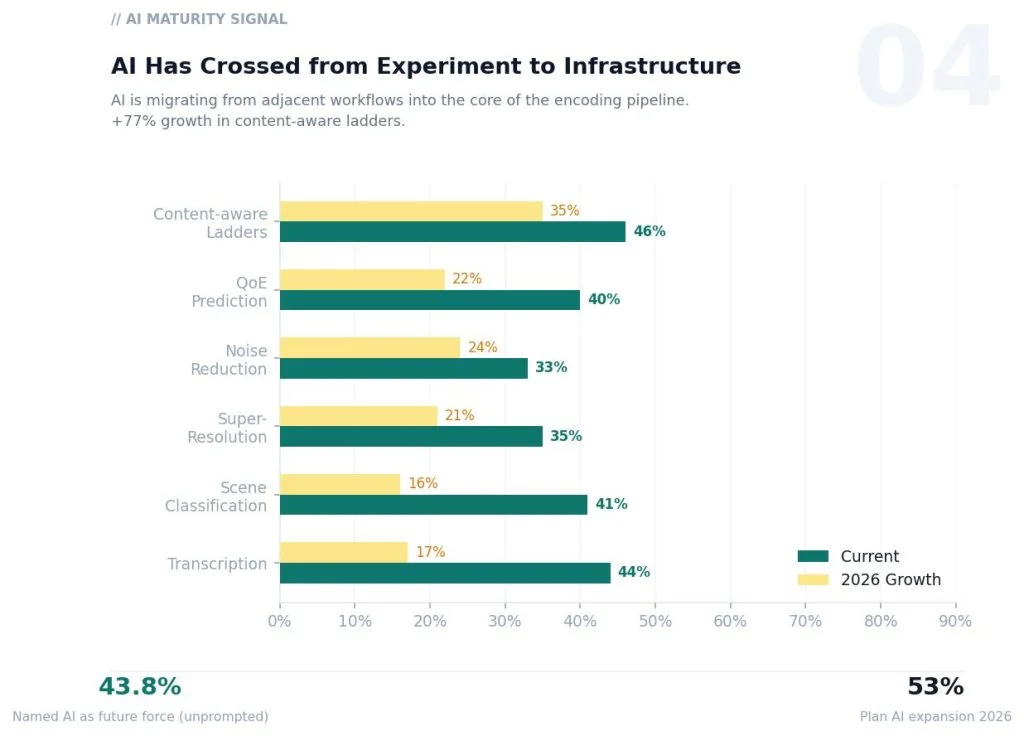
AI crossed from experiment to infrastructure

60% of respondents already use AI/ML in at least one encoding workflow. 53% plan to expand in 2026. When asked unprompted what force will shape encoding’s future, 43.8% named AI – more than double any other answer. The shift isn’t toward transcription and classification anymore. Content-aware ladder generation is growing at +77%. QoE prediction at +50%. AI is moving into the core of the pipeline.

Infographic bar chart titled 'AI Has Crossed from Experiment to Infrastructure' comparing Current vs 2026 Growth across six AI maturity categories (Content-aware Ladders, OoE Prediction, Noise Reduction, Super-Resolution, Scene Classification, Transcription), with final values around 43.8% and 53%
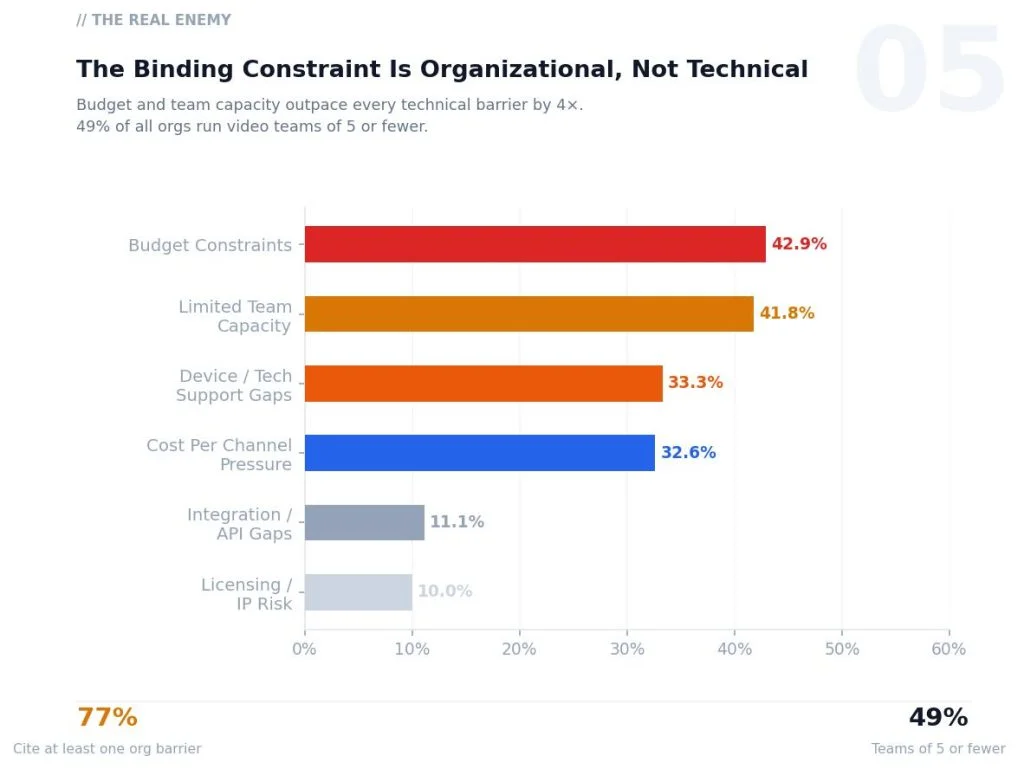
Bar chart showing organizational barriers as top constraints: Budget Constraints 42.9%, Limited Team Capacity 41.8%, Device/Tech Support Gaps 33.3%, Cost Per Channel Pressure 32.6%, API/Integration Gaps 11.1%, Licensing/IP Risk 10.0%.

05

The real blocker isn't technology

Budget constraints and limited team capacity each affect over 40% of respondents. Technical barriers – integration gaps, licensing risk – trail by a factor of four. 49% of all video teams have five or fewer people. The organizations that win in this market will be the ones who make adoption easy, not just capable.

06

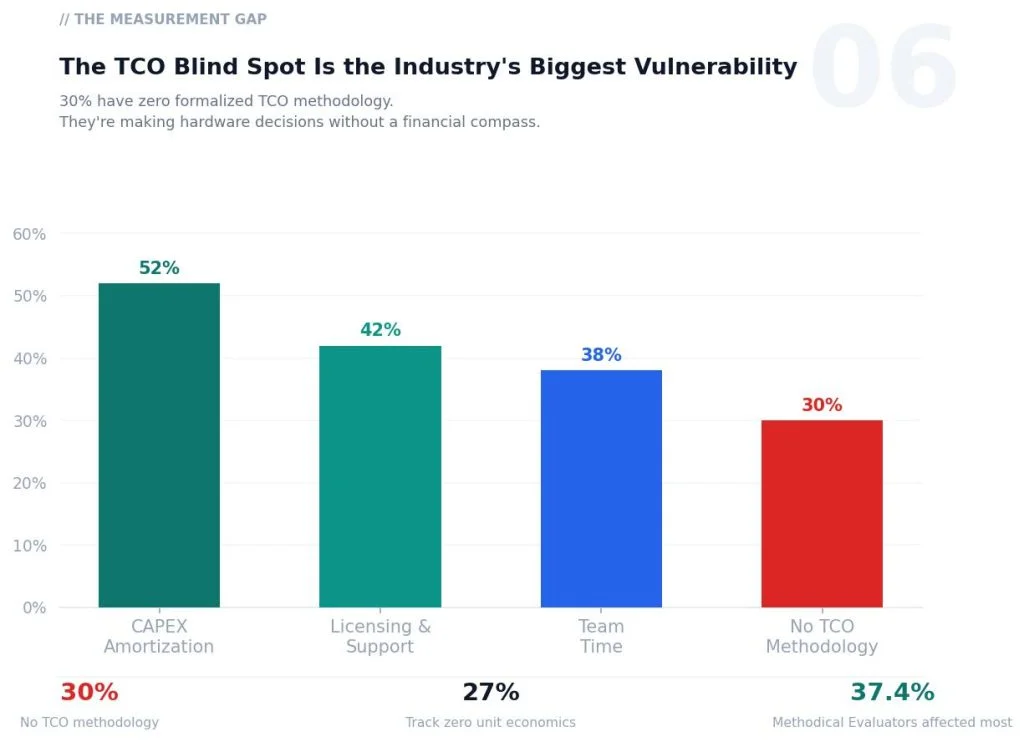
30% of the market is flying blind on cost

Nearly a third of respondents have no formalized TCO methodology. They’re making hardware decisions – codec selection, infrastructure investment, vendor evaluation – without a financial baseline to compare against. The largest buyer segment in the survey (Methodical Evaluators, 37% of the market) has the highest rate of untracked unit economics.

Bar chart showing TCO gaps: CAPEX amortization 52%, Licensing & Support 42%, Team Time 38%, No TCO methodology 30%.
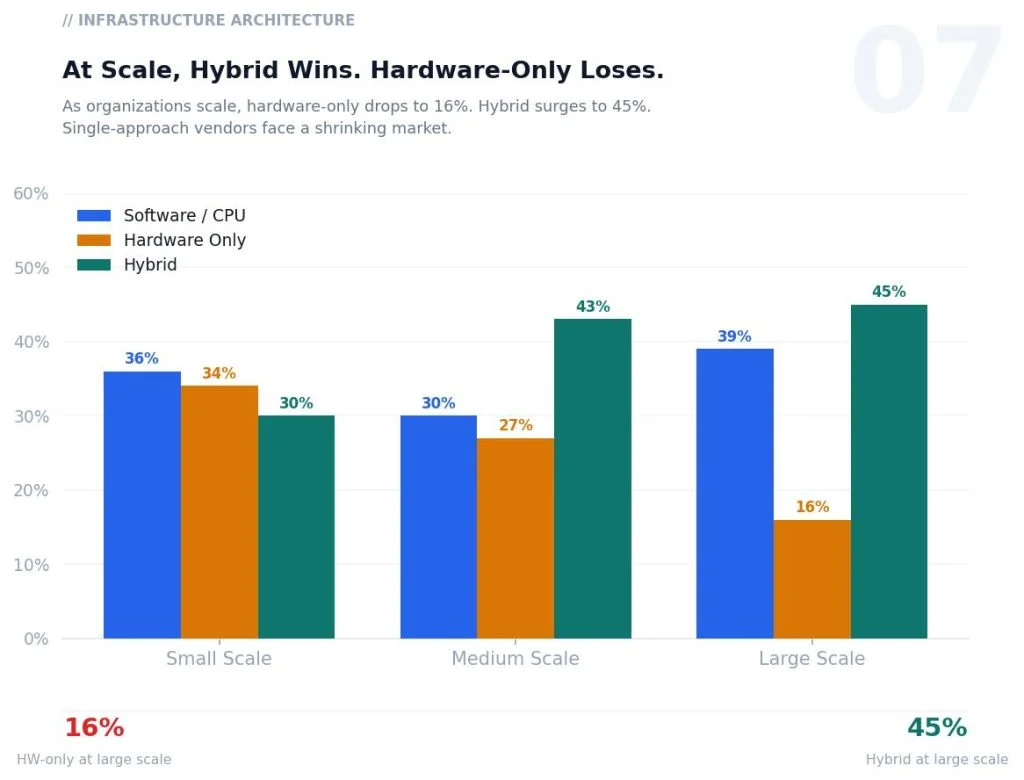
Infographic: At scale, Hybrid wins. Bar chart shows Software/CPU, Hardware Only, and Hybrid shares by scale: Small 36%/34%/30%, Medium 30%/27%/43%, Large 39%/16%/45%.

07

At scale, hybrid wins.
Hardware-only loses

At small and medium scale, organizations split roughly evenly between software and hardware approaches. At large scale, hardware-only drops to 16% and hybrid surges to 45%. Single-approach vendors are facing a shrinking addressable market as organizations grow.

08

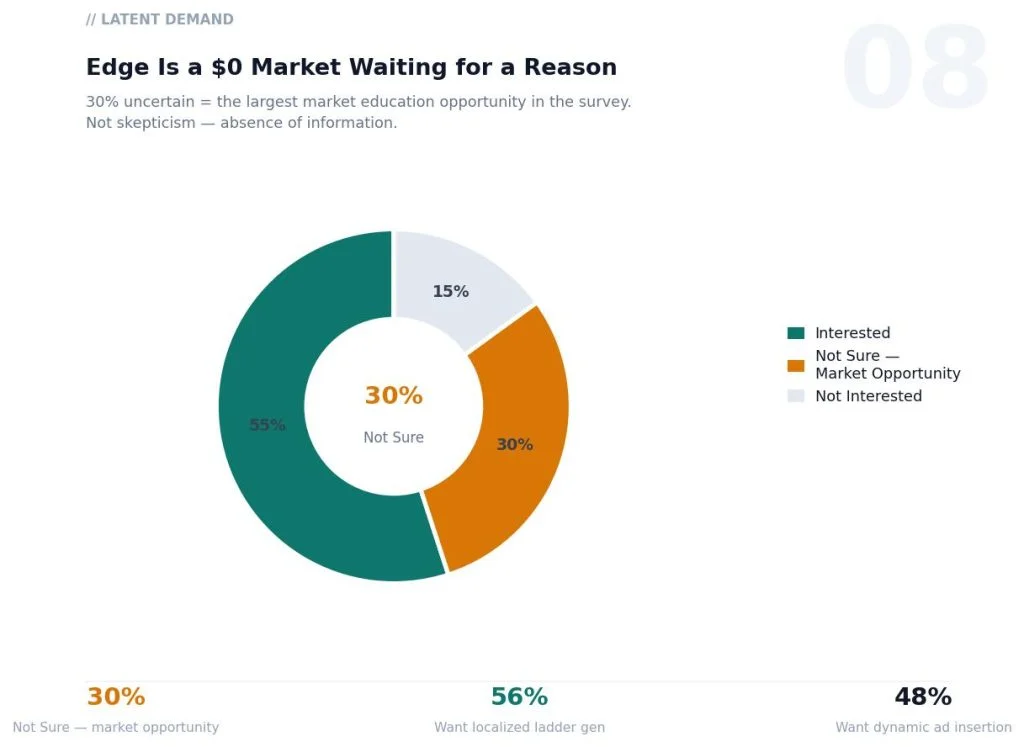
Edge has strong interest and a large undecided middle

42% of respondents expressed interest in edge encoding deployment. 30% said they weren’t sure – the largest undecided segment in the entire survey. That 30% isn’t skepticism. It’s the absence of clear information, reference architectures, and proof of ROI at their scale.

Infographic showing latent demand with a donut chart: 55% Interested, 30% Not Sure, 15% Not Interested; legend maps colors to each category.
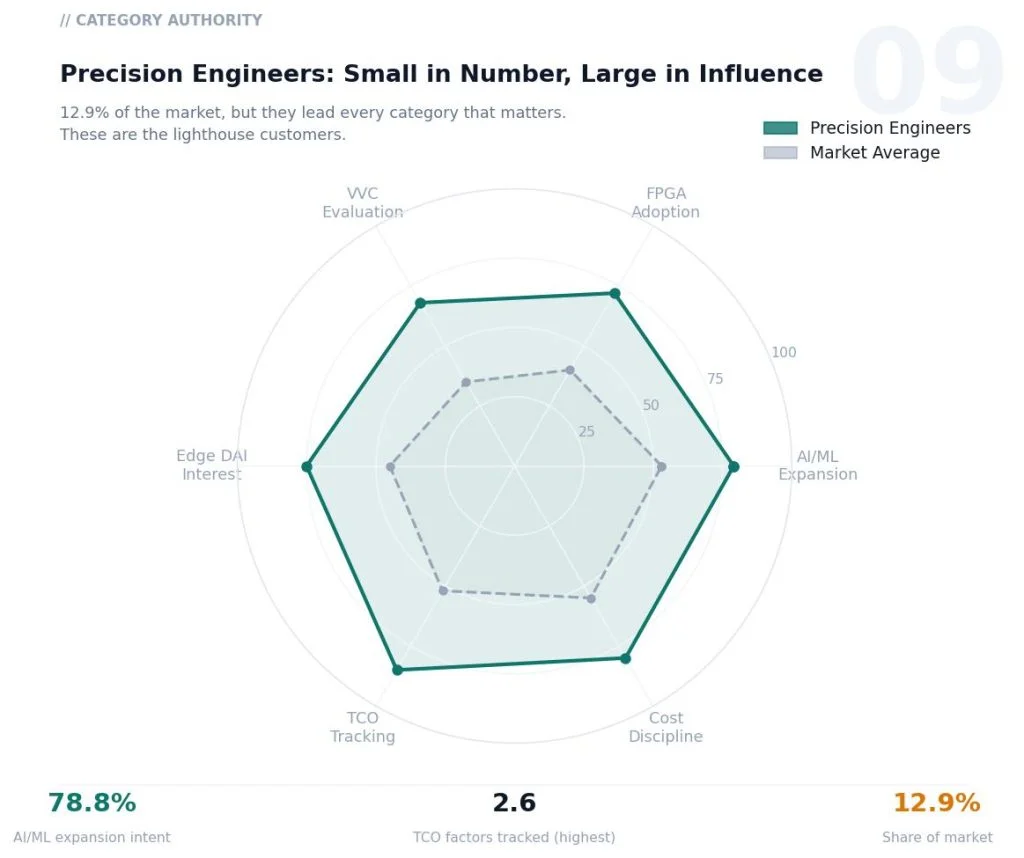
Radar chart comparing precision engineers (green) to market average (gray) across categories: AI/ML expansion, cost discipline, TCO tracking, edge DAI interest, WC evaluation, FPGA adoption. Bottom metrics show 78.8% AI/ML expansion intent, 2.6 TCO factors tracked, 12.9% share of market.

09

A small segment sets the direction for everyone

Precision Engineers are 12.9% of the market. They lead in AI/ML expansion intent (78.8%), TCO sophistication (2.6 factors tracked on average), AV1 adoption, FPGA adoption, and edge interest. They’re build-oriented, ROI-driven, and they shape vendor roadmaps. Win them and you shape the narrative.
10

There are four buyer types. One default approach misses three of them

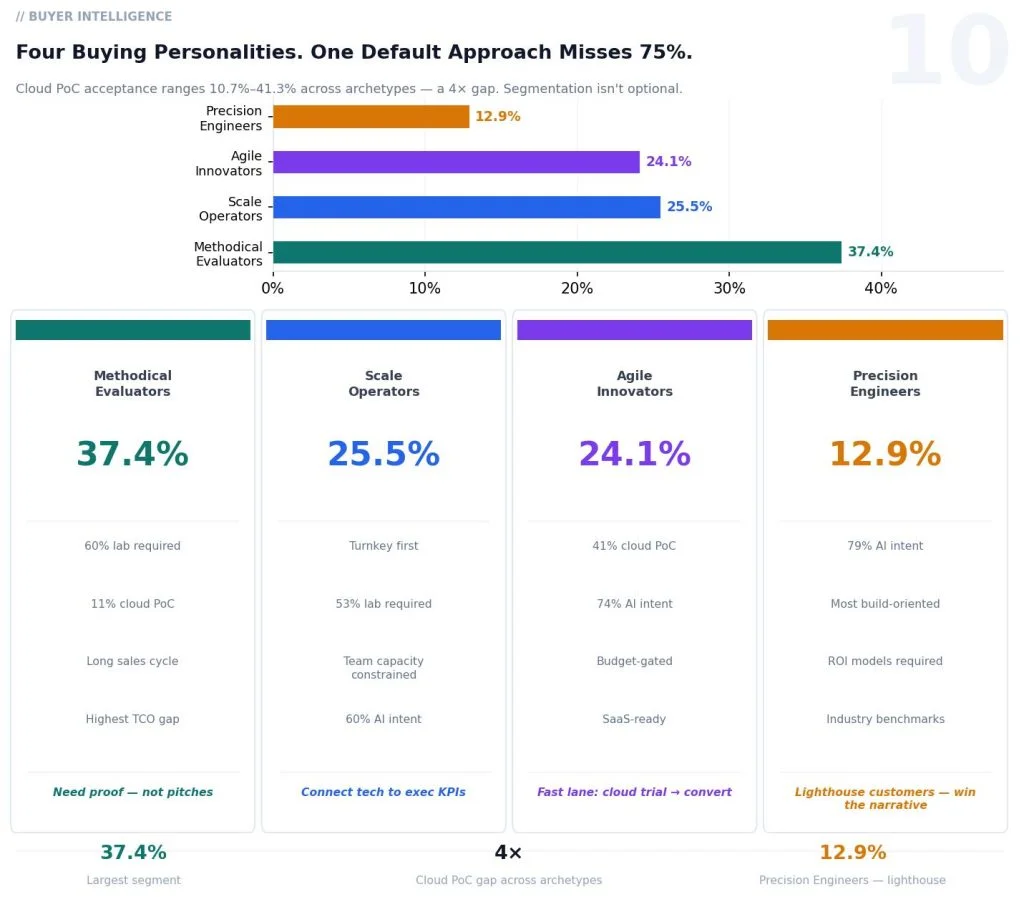
The data reveals four distinct buying archetypes – and cloud PoC acceptance alone ranges from 10.7% to 41.3% across them. Methodical Evaluators (37% of the market) require physical hardware in their lab and long sales cycles. Agile Innovators are SaaS-ready and cloud-first. Scale Operators want turnkey and headcount-neutral. Precision Engineers demand detailed ROI models. A single go-to-market motion leaves most of the market underserved.

Infographic showing four buying personalities with percentages: Methodical Evaluators 37.4%, Scale Operators 25.5%, Agile Innovators 24.1%, Precision Engineers 12.9%.

The full report includes 46 pages of data, archetype analysis, and recommendations by stakeholder type.

Codec adoption trajectories. Hardware acceleration patterns. Executive vs. engineering priority gaps. Build vs. buy orientation. TCO maturity. 2027 projections.

Free. No paywalls after download.

* Data collected Q4 2025. Published by NETINT Technologies. n=286 video professionals across streaming, broadcast, and enterprise video.

Placeholder image indicating missing or unavailable visual content, used when the image cannot be loaded.